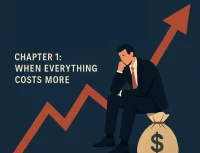
The Divergence That Has Never Happened Before
Your portfolio is about to face the biggest economic shift in 30 years, and most investors have no idea what’s coming. Right now, there are two critical economic indicators diverging in a way we have not seen since the 1920s. This divergence has historically preceded massive market resets that either destroy wealth or create generational opportunities.
Consumer confidence in the stock market is at euphoric levels, higher than during the dot-com bubble of 2000. Yet consumer sentiment about their own economic future is at literally Great Financial Crisis levels. This has never happened before in modern economic history. The gap between these two measures is screaming that something is about to break.
About 50% of consumers expect stock prices to be higher over the next 12 months. That confidence is sitting at near the highest reading we’ve seen in 30 years, even higher than what we saw during the 2000 dot-com bubble. Meanwhile, the University of Michigan consumer sentiment index just put out that consumer sentiment is at 53—down 24% from a year ago. That’s literally what we saw during the depths of the Great Financial Crisis.
So we have a bizarre situation where people are betting on stocks while simultaneously feeling hopeless about their own economic future. This tells us that there is something fundamentally broken in the economic system. People are essentially saying, “I can’t afford my life, but I think the stocks will keep going up, so let’s leverage up.” It’s a symptom of a deeper problem.
If history repeats, we could see a violent repricing of assets similar to the 1930s crash. Your stocks, your real estate, your retirement accounts—everything could be affected. But there is also a massive opportunity if you position yourself correctly.
The Income Growth That Disappeared
To understand what’s happening, we need to look at income growth—real income growth in the US. Real income is the amount of money you earn after inflation has nibbled away at it. From the 1960s to 2008, personal income grew about 2.8% per year. Predictable, reliable growth that allowed people to plan their financial future. If you were 25 years old in 1980, you could reasonably predict what your income would be at age 45.
Then the great divergence begins. After 2008, things changed. The financial crisis meant that personal income growth is consistently falling short of that long-term trajectory. Think about someone in 1999 planning their financial future. Based on historic trends, they had certain expectations of what their income would be in say 2019. The reality wasn’t as happy as they thought it would be.
For over 15 years, Americans have been earning less than they expected based on the historical pattern. The personal savings rate in the US is now just 4.6%. Historically, it was 13%. So Americans are saving less because they have less to save.
Now contrast that with what’s happening in the stock market. Real income since 2010 has gone up 50%. The stock market’s gone up 300%. And this is after inflation—these numbers have been adjusted for inflation. Just last year, the S&P 500 went up about 25%. This year so far, we seem to be looking at about 17%. We’re going three years in a row with 20% plus returns. Not something we’ve seen since the late 1990s.
So on one side, you have people grown used to being disappointed by their income. They’re earning less than they expected. They’re saving less than they should. But on the flip side, the stock market returns have blown past most people’s wildest expectations.
But if you’re a retail investor, this critical information means that the stock market gains you’ve enjoyed might not be as sustainable as they appear. Because historically, we’ve never had a very long run of high returns in the market that wasn’t followed by pretty disappointing returns.
The Corporate Profit Machine
To understand why stocks keep going up while everybody else struggles, we need to look at corporate profit margins. Since the 1980s, the average personal savings rate in America has been trending lower—gone from 13% to just 4%. Miserable. But American savings are declining. Corporate profit margins, though? They’re increasing. They’re near record levels.
Corporate profits are at $2 trillion, up almost 5% year-over-year. This is not a coincidence. It’s directly connected to why regular Americans are struggling. It’s the shareholder class versus the working class.
Here’s how it works. Corporate profits ultimately get handed out to shareholders. It could be through dividends or it could be through higher share prices, but they basically get the money. So unlike wage earners, shareholders don’t spend most of the income they receive. Instead, most of that gets back into stocks, financial assets. That’s where the money flows.
What kind of financial assets does it flow into? Home prices are at record highs. Seven times the yearly income is the average house price. That used to be about 4x. So housing has essentially become twice as unaffordable as it used to be. Gold just hit an all-time high. Bitcoin is at $125,000. The S&P is also trading at a monster valuation, about 30% higher than it is on average.
And all of this is fueled by that record corporate profit monster. It creates a vicious circle. You have higher asset prices. What does it do? It means some people have a lot more money. So what does that mean? Well, they buy housing because it’s also an investment. So housing prices go up. They become less affordable.
Now, housing prices are also the largest part of the inflation measure, the US inflation measure. So what happens? Well, inflation goes up and your wage earner—housing is now an even bigger part of the income pie. So they actually have basically nothing left to invest. Whereas the asset owners, the wealthy—high asset prices. Corporate profits get paid to shareholders. They put it back into stocks. Those stocks create more profits. So they get more money.
The Inequality That Matches The 1920s
The level of inequality is absolutely through the roof. We’re literally at 1920s levels. The top 1% now own something like 35 to 38% of all US wealth, depending on what measure you look at. They own 54% of all stocks. Crazy, eh? The bottom 50% have about 3% of all wealth. That’s insane, isn’t it?
So the American dream is dying, folks. I’m not saying people can’t make it—people can make it, but most don’t. And if you go back to 2000, about 75% of Americans said that they had a good chance of improving their standard of living. By 2010, that was 50%. Today, that number is 25%.
So people are disillusioned. Three-quarters of Americans no longer believe in the economic American dream. Massive shift over the last 25 years. And it explains why consumer sentiment is so low even as the stock market soars.
In practical terms, this means many households remain stuck exactly where they are throughout their life. Their expenses rise. Their ability to build wealth through asset ownership doesn’t keep pace because they haven’t got enough money left over. Meanwhile, those who already own assets see their wealth compound year after year.
And this gap can’t continue indefinitely. History shows us that when wealth inequality reaches these extreme levels, something eventually forces a reset. And that reset is what we need to prepare for.
The Historical Pattern That Rhymes
What we’re seeing today has happened before. And understanding that historical pattern is crucial to knowing what comes next. Smart people study history because it rhymes.
The peak in wealth inequality in 1929 coincided perfectly with the top of the stock market. Back then, rising asset prices, particularly stocks and housing, contributed to extreme wealth inequality. The wealthy owned most of the assets and they kept getting wealthier. Regular Americans were priced out, and it was the catalyst for change.
The market crash that followed between 1929 and 1940 coincided with the beginning of a reversal in wealth inequality. But it didn’t just happen on its own. There was a catalyst that was needed, and that catalyst was a dramatic change in corporate tax.
In the 1910s, the top corporate tax rate was zero. Policymakers then changed that to 40%. And that set off the economic reset of the 30s and 40s. Partly triggered the Great Depression. It was economically painful. There’s no sugar coating that—it squeezed corporate profits dramatically. It dragged asset prices lower. It caused unemployment to rise. But it did somehow help flip the wealth inequality trend that had been climbing for decades.
And what followed was the golden age. From the 40s to the 70s, America had a thriving middle class. This was one of the most prosperous periods in US history for the average American. Wealth was more evenly distributed. The American dream was actually achievable for most people.
Build a Career That Shapes a Better Planet
The next generation of leaders isn’t chasing titles—they’re building impact. Whether it’s renewable energy, sustainability, or social enterprise, the world needs your skills and your sense of purpose more than ever.
Explore Purpose-Driven Jobs →The Reversal That Created Today’s Crisis
Then in the 80s, the reversal begins. Corporate tax rates started coming down again. US corporations were under real strain. Profit margins were squeezed. The economy was struggling. High inflation, weak growth. So what happened? Policymakers cut taxes to relieve the pressure on businesses.
And it worked. The economy accelerated. Between 82 and 99, the S&P created about 20% a year gains—a little bit like what we’re seeing right now. But behind the scenes, it created wealth inequality.
So today, the corporate tax rate sits at about 21%—lowest level since the 30s. Wealth inequality has risen. Not a coincidence.
So the pattern is clear. Lower corporate taxes have allowed profit margins to stay very healthy. The US consumer has been under a lot of pressure. Inflation eating up their wages. And it has fueled this asset price appreciation.
I’m not complaining. I own a lot of assets. I benefit from this. But regular Americans struggle with stagnant wages and rising costs. And eventually what happens is that those guys are going to vote in somebody who’s going to give them higher taxes on the wealthy and the corporations. That’s typically what happens, right? People get angry. People get disenfranchised.
The Two Scenarios For Reset
Based on everything we’ve covered, a great economic reset is coming. Not if, but when. And there are essentially two ways this can happen. Understanding both scenarios is critical.
You have the more violent approach, which is a stark repricing of assets. Say stock market drops 30%, real estate drops—triggered by corporate tax hikes. Say Americans vote in some lefty lobby and he says, “Let’s tax the rich.” Look at New York, right? It’s what’s going on there. It’s a popular and easy way to win elections because the easiest way to win an election is to create an external enemy.
If you’re running the country, you make that Russia. If you’re more local, you make it Washington. Or you could make it the rich or the corporations. It’s a much easier way because people don’t really like to look at the real problems. It’s much easier to just point a finger. That’s typically how politics works. It’s a very simple structure.
Scenario two is the quiet reset. And that’s a bit more gradual. In this scenario, stocks start to stagnate. We get like a couple of percent returns in the market. Wages catch up a little bit. Maybe unions get stronger again. There’s no dramatic crash, but it would take much, much longer. Might take a decade. So we get flat returns for a decade, which is actually pretty horrid for those of us who have a lot of assets.
Why could it go that way? Because policy changes tend to be quite sudden in the US, right? You have a very black and white political system. So if you give a majority to the other lot, then you might get something that looks a lot more like this outcome, right?
But what the smart money sees is the writing on the wall and the exits before the policy changes happen.
How To Position Yourself For What’s Coming
For now, I am very much invested in assets and I’d suggest you think about doing that too. Quality assets is where I want to be. I’m buying mostly quality stocks and a lot less sort of meme techy type stuff. Large tech stocks, gold, crypto—obviously more volatile, more risky.
And then we want to watch out for the warning signs. Are there policy shift signals? And that might come after midterms. That might come after this Trump presidency is over. You want to look at how “breadthful”—if that were a word—is the market. So at the moment, we’re seeing very few stocks driving the market higher, and that’s a dangerous signal.
And then also watch for valuations. Like if we go up another 20 or 30%, brilliant, but that might just be where things get too high. And you also want to look at the credit markets. The moment we’re seeing a lot of stress in auto loans, for example—total freaking disaster zone. No one understands it. Somebody talks about it. Reminds me a bit of 2008.
And when these warning signals kick in, well, we want to move more defensive. So people often ask me, “Felix, you got these rules. You got these three Wall Street rules. Do they work in bad economic times?” Yes, because we can always make money out of something, right?
So say you go into a recession. I’m not saying we will—the government is spending too much money for that to happen anytime soon. But what would do well in a recession? Well, how about discount retailers? There’s a number where people shop when they think the economy is bad, right? So then we just shift our money out of tech or wherever it sits right now and we go into discount retailers, right? So there is always a sector of the market that’s thriving in almost every single scenario.
Steps To Protect Your Wealth Right Now
So what could be steps to protect your wealth right now? Again, I’m not telling you what to do. I’m just saying think about these things, make your own plan, talk to your advisers, and above all build your skills.
A bit of a cash position can be a healthy thing. You don’t want to hold cash for too long as inflation erodes it. I definitely focus on quality right now. Diversification, I think, is a good thing. Don’t be—I see so many portfolios and they’re all quantum stocks or they’re all tech or they’re all AI or whatever. Like, guys, there are lots of industries out there that make a lot of money, right?
There is gold, there is real estate, there are other assets out there. And be a bit careful with the speculative stuff, the meme stocks, right? And above all, stay educated.
When the market rallies like this and the market’s up 17% this year, a lot of tech stocks are up 50, 100% whatever this year, the conclusion our brains jump to is “genius,” right? I am a genius. Whereas the reality is it’s more like right place, right time and a little bit of luck. And that’s good and you deserve that. But you have to appreciate that if the market was down 20% this year, probably would look very different.
Remember what April felt like when the tariffs kicked in, right? That can happen any week, any month, any day, and it’s definitely going to happen again, right? We get one of these every two years. It’s almost a guarantee.
So you want to have a plan that removes your emotions, that works in all market scenarios.
The Complacency Trap
I think a lot of people are getting complacent. I think a lot of people are just going, “It’s amazing the market keeps going up in a straight line.” And I hope it’ll continue to because a lot of people will make a lot of money and you all deserve it.
But at some point it always breaks. It always does. And it might not be foreseeable. It could be something like the consumer loan credit problems we’re starting to see in the car sector right now. Credit card delinquencies are through the roof. There’s a lot of things that are not looking particularly great.
And all it takes is for one bank, one institution, one credit agency to do something a little dodgy, right? And then house of cards, right? That’s what the whole thing is about. Or Nvidia comes out and the next chip breaks, you know, like that in itself would probably make the market drop 10-20%.
So you got to think this through. What happens when the sun doesn’t shine? After summer comes fall, comes winter, and then there’s the spring and the summer again. You got to understand those patterns and how to prepare yourself for those.
The divergence between stock market euphoria and personal economic despair has never happened before in modern history. When wealth inequality reaches 1920s levels and corporate profits soar while wages stagnate, history shows us a reset is coming. The question isn’t if, but when—and whether you’ll be ready.
Key Takeaway
Consumer confidence in stocks hits 30-year highs (higher than dot-com bubble) while personal economic sentiment matches Great Financial Crisis levels—a divergence not seen since the 1920s. Real income up 50% since 2010 while stocks up 300%. Top 1% owns 35-38% of wealth and 54% of stocks. Corporate profits at $2 trillion while personal savings rate drops from 13% to 4.6%. Housing costs 7x income (was 4x). Historical pattern: 1929 wealth inequality peak preceded crash and 40% corporate tax reset. Today’s 21% corporate tax (lowest since 1930s) fuels inequality. Two reset scenarios: violent 30% asset repricing from tax hikes, or quiet decade of flat returns as wages catch up. Warning signs: market concentration (few stocks driving gains), valuations 30% above average, credit stress in auto loans. Protect with quality assets, diversification beyond tech/AI, gold, cash position, and education to navigate all market scenarios.
FAQ
What is the great economic divergence?
Consumer confidence in stocks is at 30-year highs (50% expect higher prices), matching or exceeding dot-com bubble euphoria, while personal economic sentiment is at 53—down 24% from a year ago, matching Great Financial Crisis levels. This divergence hasn’t happened since the 1920s and signals a fundamental break in the economic system.
Why are people betting on stocks while feeling hopeless about their finances?
People are saying, “I can’t afford my life, but I think stocks will keep going up, so let’s leverage up.” It’s a symptom of deeper problems: real income up 50% since 2010 while stocks up 300%, personal savings rate dropped from 13% to 4.6%, and housing costs doubled relative to income. Americans earn less than expected while market returns exceed expectations.
How does corporate profit relate to wealth inequality?
Corporate profits at $2 trillion (up 5% year-over-year) flow to shareholders through dividends and stock prices. Unlike wage earners, shareholders reinvest in financial assets, creating a vicious circle: higher asset prices → wealthy buy more → prices rise further → inflation increases → wage earners have less to invest. Top 1% owns 35-38% of wealth and 54% of stocks; bottom 50% owns 3%.
What does history tell us about wealth inequality at these levels?
1929 wealth inequality peak coincided with market top. Crash (1929-1940) began inequality reversal, catalyzed by corporate tax hike from 0% to 40%. This triggered Great Depression but created 1940s-1970s “golden age” with thriving middle class. 1980s tax cuts created 82-99 bull market but rebuilt inequality. Today’s 21% corporate tax (lowest since 1930s) allows record profits while wages stagnate.
What are the two reset scenarios?
Violent reset: 30% stock/real estate drop triggered by corporate tax hikes (politicians taxing “the rich” wins elections). Quiet reset: stocks stagnate for a decade with 2-3% returns, wages catch up, unions strengthen—no crash but terrible for asset holders. Policy changes in US are sudden and binary, so outcome depends on which party gets majority.
How can I protect my wealth?
Focus on quality assets, not meme stocks or pure tech/AI. Diversify beyond tech—gold, real estate, other industries. Maintain cash position (but limit duration due to inflation). Watch warning signs: market concentration (few stocks driving gains), valuations 30% above average, credit stress (auto loans, credit cards). Build skills to navigate all scenarios—recessions favor discount retailers, for example. Have a plan that removes emotions and works in all market conditions.